One of the biggest findings from the 2020 Census data release was that the U.S. population is more diverse than ever. Using its Diversity Index, the Census Bureau has found that the likelihood that two people chosen at random will be from different racial and ethnic groups has increased from 54.9% in 2010 to 61.1% in 2020.
While this is a nationwide trend, some areas are obviously going to be more diverse than others. Let’s take a look at which cities in the U.S. are the most diverse.
Quick List: The Most Diverse Cities In America
Here are the most diverse cities in the country, according to WalletHub.
Of course, statistics don’t tell the whole story, and many of our country’s more racially diverse cities are also its most segregated.
Let’s break down the data, then go into detail what this means for each city.
See What You Qualify For

Buy A Home
Discover mortgage options that fit your unique financial needs.

Refinance
Refinance your mortgage to have more money for what matters.

Tap Into Equity
Use your home’s equity and unlock cash to achieve your goals.
The Most Diverse Cities In The US
These 10 most diverse cities in America come from data pulled by U.S. News And World Report. Each of these large cities has over 300,000 people within its city limits.
1. Houston, Texas
- Population: 2,304,580
- Population breakdown:
- American Indian and Alaska Native: 1.2%
- Asian: 7.3%
- Black or African American: 22.6%
- Hispanic or Latino: 44%
- Native Hawaiian and Pacific Islander: 0.1%
- White alone, not Hispanic or Latino: 23.7%
- Some other race: 20.7%
- Two or more races: 16.1%
- White: 31.1%
- Median home sales price: $317,320
Houston has a large Hispanic and Latino population, and a huge portion of Houstonians speak a language other than English at home – just 51.5% speak English only, while 38.9% speak Spanish, according to the Census Bureau.
Houston is a great place to live or visit if you’re looking to experience the many different cultures the U.S. has to offer through food; the city was recently named one of the “World’s Greatest Places of 2021” by Time magazine, which lauded Houston’s many culinary options.
2. Jersey City, New Jersey
- Population: 292,449
- Population breakdown:
- American Indian and Alaska Native: 0.7%
- Asian: 28%
- Black or African American: 19.9%
- Hispanic or Latino: 24.9%
- Native Hawaiian and Pacific Islander: 0.1%
- White alone, not Hispanic or Latino: 23.8%
- Some other race: 14.4%
- Two or more races: 9.7%
- White: 27.3%
- Median home list price: $675,000
Just across the Hudson River from New York City (another list topper), Jersey City snagged WalletHub’s #2 spot. Not only that, but it also earned the #1 ranking for cultural diversity, which is defined by an area’s racial and ethnic diversity, its linguistic diversity and its birthplace diversity.
The city’s linguistic diversity, in particular, is quite impressive. Per the Census Bureau, less than half of Jersey City denizens speak only English at home; 23.2% speak Spanish, 14% speak another Indo-European language (this group includes languages like Italian, Persian or German), 11.5% speak an Asian or Pacific Islander language and 4.4% speak some other language (this could include languages such as Arabic, Hebrew, or Native languages like Navajo).
3. New York, New York
- Population: 8,804,190
- Population breakdown:
- American Indian and Alaska Native: 1%
- Asian: 15.7%
- Black or African American: 22.1%
- Hispanic or Latino: 28.3%
- Native Hawaiian and Pacific Islander: 0.1%
- White alone, not Hispanic or Latino: 30.9%
- Some other race: 17%
- Two or more races: 10.1%
- White: 34.1%
- Median home sales price: $662,883
Famous for its diversity, it’s impossible to visit New York City without coming into contact with traditions, foods, languages and people that hail from all around the world. With its many ethnic neighborhoods, NYC may be better described as a “salad bowl” than a “melting pot.” From Little Italy to Little Guyana, there’s a home for everyone in New York.
4. Dallas, Texas
- Population: 1,304,379
- Population breakdown:
- American Indian and Alaska Native: 1.2%
- Asian: 3.7%
- Black or African American: 23.3%
- Hispanic or Latino: 42.3%
- Native Hawaiian and Pacific Islander: 0.1%
- White alone, not Hispanic or Latino: 28.1%
- Some other race: 19.5%
- Two or more races: 16.2%
- White: 36.1%
- Median home list price: $396,363
Dallas’s religious diversity, cultural diversity and socioeconomic diversity played big parts in its overall ranking, earning the #43, 47 and 68 spots in each category, respectively (out of the hundreds of cities included in WalletHub’s rankings).
This city is proud of its cultural makeup, which includes folks from many different ethnicities, religions and backgrounds. Dallas is also home to one of the state’s best gay neighborhoods, Oak Lawn.
5. Los Angeles, California
- Population: 3,898,747
- Population breakdown:
- American Indian and Alaska Native: 1.7%
- Asian: 11.9%
- Black or African American: 8.6%
- Hispanic or Latino: 46.9%
- Native Hawaiian and Pacific Islander: 0.2%
- White alone, not Hispanic or Latino: 28.9%
- Some other race: 29.5%
- Two or more races: 13.3%
- White: 34.9%
- Median home sales price: $906,123
Los Angeles is another city that, like New York, is home to a plethora of ethnic enclaves and an extremely diverse, vibrant population. It’s often listed as the creative capital of the world, given all the jobs in creative industries of entertainment and culture.
Just 41.1% of Angelenos speak only English at home, with slightly more (42.2%) speaking Spanish. Close to half of the population is Hispanic or Latino.
6. Gaithersburg, Maryland
- Population: 69,657
- Population breakdown:
- American Indian and Alaska Native: 0.9%
- Asian: 19.1%
- Black or African American: 16.6%
- Hispanic or Latino: 28.5%
- Native Hawaiian and Pacific Islander: 0.1%
- White alone, not Hispanic or Latino: 31.5%
- Some other race: 17.1%
- Two or more races: 11.4%
- White: 34.8%
- Median home list price: $404,995
D.C. suburb Gaithersburg earned the #2 spot for both socioeconomic diversity (which is defined as household income diversity and educational attainment diversity) and cultural diversity. Spanish is the second most-spoken language here, followed by Asian and Pacific Islander languages.
7. Silver Spring, Maryland
- Population: 81,015
- Population breakdown:
- American Indian and Alaska Native: 1.2%
- Asian: 7.5%
- Black or African American: 28.7%
- Hispanic or Latino: 26.9%
- Native Hawaiian and Pacific Islander: 0.1%
- White alone, not Hispanic or Latino: 32.3%
- Some other race: 16.3%
- Two or more races: 11.3%
- White: 35%
- Median home list price: $460,000
Silver Spring is another D.C. suburb with an impressive amount of diversity, particularly when it comes to socioeconomic and cultural diversity, for which it earned the #1 and #5 spots, respectively.
The foreign-born population is significantly higher in Silver Spring than it is in the overall U.S. – in Silver Spring, 38% of residents are foreign born.
8. Arlington, Texas
- Population: 394,266
- Population breakdown:
- American Indian and Alaska Native: 1.1%
- Asian: 7.7%
- Black or African American: 22.9%
- Hispanic or Latino: 30.7%
- Native Hawaiian and Pacific Islander: 0.1%
- White alone, not Hispanic or Latino: 34.9%
- Some other race: 13.6%
- Two or more races: 14.1%
- White: 40.5%
- Median home list price: $299,936
Arlington is situated between Dallas and Fort Worth and is home to the University of Texas at Arlington, an active research university that’s been ranked both as a top performer for social mobility – meaning that a high percentage of economically-disadvantaged students graduate – and one of the most diverse undergraduate campuses in the country by the U.S. News and World Report.
9. Long Beach, California
- Population: 466,742
- Population breakdown:
- American Indian and Alaska Native: 1.5%
- Asian: 13%
- Black or African American: 12.5%
- Hispanic or Latino: 43.3%
- Native Hawaiian and Pacific Islander: 0.9%
- White alone, not Hispanic or Latino: 26.1%
- Some other race: 25.6%
- Two or more races: 14.4%
- White: 32%
- Median home sales price: $710,421
Long Beach is known for its waterfront attractions and vibrant LGBTQ+ community.
The city’s two higher education institutions – California State University, Long Beach and Long Beach City College – are incredibly diverse. They also have above-average graduation rates along with high post-graduation salary rates.
This city, like many of the other pricey locales on this list, is very diverse but expensive to live in, which can make it a difficult place to make a home for those who are already economically disadvantaged.
10. Danbury, Connecticut (tie)
- Population: 86,518
- Population breakdown:
- American Indian and Alaska Native: 0.6%
- Asian: 6.2%
- Black or African American: 7.2%
- Hispanic or Latino: 33.2%
- Native Hawaiian and Pacific Islander: 0.04%
- White alone, not Hispanic or Latino: 43.9%
- Some other race: 21.6%
- Two or more races: 16.1%
- White: 48.1%
- Median home sales price: $370,000
Danbury, a small city in southwest Connecticut, tied with Chicago for the 10th-place spot. In the 19th century, Danbury was known as “Hat City” because it was the center of the country’s hat production, according to ConnecticutHistory.org (prior to this, it was known as Beantown, thanks to its quality bean crops).
In Danbury, there’s a large amount of linguistic diversity, with 45.5% of residents speaking a language other than English at home, according to the Census Bureau.
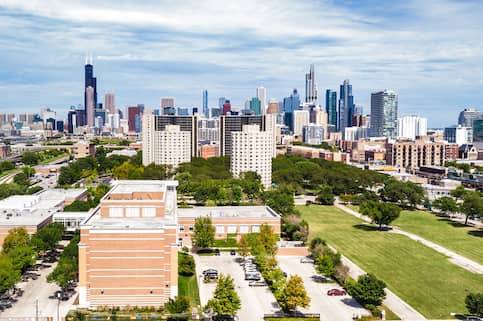
10. Chicago, Illinois (tie)
- Population: 2,746,388
- Population breakdown:
- American Indian and Alaska Native: 1.3%
- Asian: 7%
- Black or African American: 29.2%
- Hispanic or Latino: 29.8%
- Native Hawaiian and Pacific Islander: 0.04%
- White alone, not Hispanic or Latino: 31.4%
- Some other race: 15.8%
- Two or more races: 10.8%
- White: 35.9%
- Median home sales price: $344,353
Chicago is an extremely diverse city where you can sample cuisine from cultures across the world. The city’s famous Taste of Chicago festival is a great place to do that.
However, as many scholars have pointed out, Chicago is a very segregated city. According to University of California, Berkeley’s “the Roots of Structural Racism” project, Chicago is the fourth most-segregated city in the country.
Ready for a change?
Find top-rated movers and compare multiple quotes on HomeAdvisor.
The Bottom Line
While the stats show that these U.S. cities are diverse, that doesn’t mean they’re equitable. Many of our country’s greatest challenges affect non-white people more than white people, whether it be pollution, income inequality or COVID-19.
Many cities are making efforts to change, to truly invest in all their residents, not just some. These programs range from job training, to ending homelessness, to addressing the wounds of racism. With rising awareness of systemic racism, companies, organizations and local governments are pledging money and muscle to make a difference.
Diversity is consistently listed as a major motivator for young people moving to cities. Many population scientists believe that the U.S. will be less than 50% white by 2050. Cities looking to draw in young talent will need to acknowledge and address various systems of inequity to secure their future as great cities.


Victoria Araj
Victoria Araj is a Staff Writer for Rocket Companies who has held roles in mortgage banking, public relations and more in her 15-plus years of experience. She has a bachelor’s degree in journalism with an emphasis in political science from Michigan State University, and a master’s degree in public administration from the University of Michigan.