
Over 27 million Americans moved in 2021.1 While some stayed close to home, others ventured to new cities and states to explore all the U.S. has to offer. But what’s attracting new residents and which are the fastest growing cities in the U.S.?
Our study looked at census population data with consideration for new residential buildings, GDP and employment rates to identify the top growing cities with economic prosperity and hot real estate markets to accommodate their growth.
Here are a few of our key findings and the 20 fastest-growing cities in America as we enter 2023:
Data used in this study was compiled prior to Hurricane Ian’s landfall in October 2022 and doesn’t account for the devastation that continues to impact coastal communities. |
|---|
Key Findings:
- Warm weather cities in the Southern U.S. experienced the most growth between 2020 and 2021.
- Florida is the fastest-growing state and earned four positions in our top five fastest-growing cities.
- New Braunfels, Texas, experienced the largest population boom with an 3% increase to 98,857 residents.
See What You Qualify For

Buy A Home
Discover mortgage options that fit your unique financial needs.

Refinance
Refinance your mortgage to have more money for what matters.

Tap Into Equity
Use your home’s equity and unlock cash to achieve your goals.
Fastest-Growing Cities:
1. Cape Coral – Fort Myers, Florida
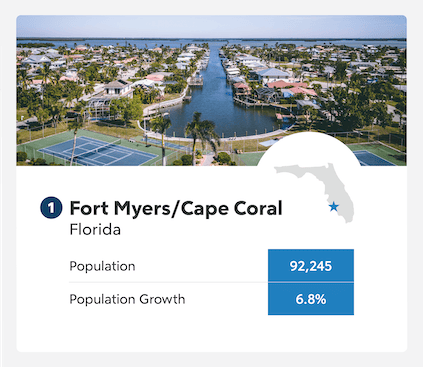
Prior to the devastation of Hurricane Ian, Fort Myers and Cape Coral was the fastest growing area in the country. In fact, Florida nearly swept the board of fastest-growing cities, earning six of the top 10 spots and leading the pack with the Cape Coral – Fort Myers metropolitan area. These cities are located on a peninsula in southwest Florida, surrounded by coasts that attract tourists and new residents alike.
Fort Myers ranked second overall for largest population growth, and Cape Coral wasn’t far behind in fifth place. Both cities also ranked second for new residential building permits, indicating that the cities aren’t expecting growth to slow anytime soon.
- Fort Myers experienced a 6.8% population increase between 2020 and 2021, while Cape Coral’s population grew 4.2%.
- The Cape Coral-Fort Myers metro area approved 11,020 single-unit residential building permits in 2021 – a whopping 61% increase from the previous year.
- The metropolitan area experienced an 8.4% employment increase between August 2020 and 2021.
2. North Port, Florida
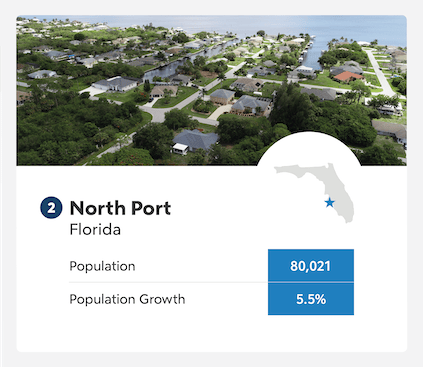
Up the western coast of Florida is the city of North Port in Sarasota County. The city is known for its natural springs, including Warm Mineral Springs Park, where the spring-fed pool maintains an 85ºF temperature year-round and its abundance of rich minerals are celebrated for potential healing properties.
Residents that prefer a saltwater dip don’t have far to travel to reach the Gulf Coast, and the city encompasses many of Florida’s other great qualities, too. Klaus Gonche is a Compass real estate advisor who’s seen his fair share of interstate moves to the Sunshine State.
“Our year-round weather is a major magnet for both retirees and young professionals who now have more flexibility to work remotely,” he says. “Another major factor is our local tax environment with no state income tax.”
- North Port ranked third in population growth with a 5.5% increase year over year.
- The city’s GDP increased 1.3% between 2019 and 2020 – 26th in our study.
- North Port had the 10th highest employment increase in our study at 7.7%.
3. Winter Haven, Florida
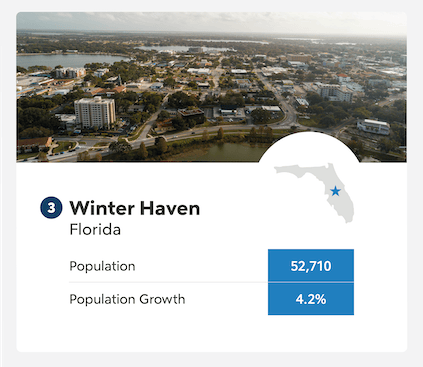
The Chain of Lakes City, just east of Tampa, may not have miles of beach access, but it does have over 50 lakes to enjoy. Families looking for a break from swimming and sunning at freshwater beaches are also just a 36-minute drive from Walt Disney World in Orlando.
Recreation opportunities and affordable living are significant factors for families planning their next move, according to Gina Baker, real estate analyst with Fit Small Business, who says, “Florida, Texas and North Carolina are among the most popular destinations for movers. These areas are not only in warm weather climates, but they allow for outdoor activities, a semi-metro environment and more affordable living expenses and home prices than New York, New Jersey or California.”
Winter Haven ranked fifth for overall population growth and 10th for residential building permits to account for the influx of new residents. The city’s economically strong, too, with the sixth-highest GDP growth of our city study.
- Winter Haven’s population increased 4.2% to 52,710 residents in 2021.
- The metropolitan GDP increased 3.1% between 2019 and 2020.
- Single-unit residential housing permits increased 43% between 2020 and 2021.
4. New Braunfels, Texas
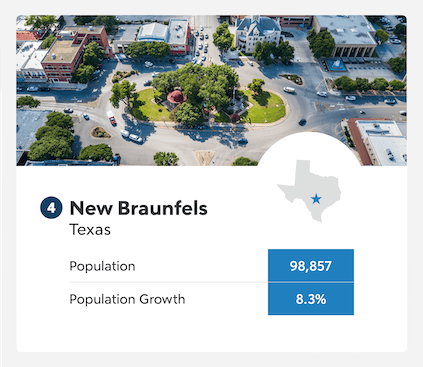
New Braunfels is located between Texas’ capital city of Austin and San Antonio, right along I-35 in the beautiful Texas Hill Country. The city’s known for its Hispanic and German heritages and kicks off each fall with the Wurstfest sausage festival.
If we counted population growth alone, New Braunfels easily wins with an explosive 8.3% increase between 2020 and 2021. However, the city’s metropolitan GDP growth was the lowest of our top 10 cities, with a 10% decrease in 2020.
- New Braunfels experienced the largest population growth in our study at 8.3%.
- The city ranked among the top 25 for new residential construction with a 32% increase in single-unit building permits.
- Employment rates rose 5.3% between August 2020 and 2021.
5. Port St. Lucie, Florida
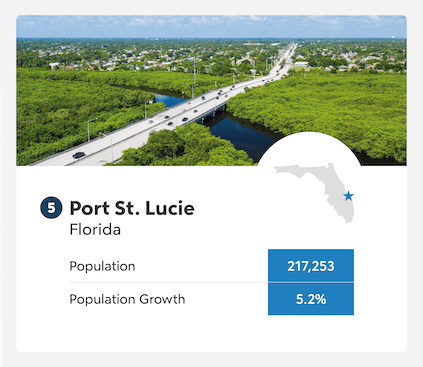
Port St. Lucie is nestled between Orlando and Miami along Florida’s southeast “Treasure Coast.” Nature preserves and nearby beaches offer plenty of outdoor recreation space, while sports fans can enjoy the New York Mets’ annual training camp each spring and gorgeous green golf courses year-round.
This marks our fourth Florida city in the top five, which real estate professional Bill Samuel of Blue Ladder Development attributes to great weather and tax benefits.
“A large portion of America’s population is entering retirement and these individuals typically prefer to move to areas with warmer climates and communities/amenities geared towards retirement,” he says. “In addition to warmer climates, retirees are focusing on states that lower income and property taxes.”
- Port St. Lucie ranked fourth in population growth with a 5.2% increase.
- The city’s also in the top 20% for residential building permits with a 34% increase for single-family units in 2021.
- Metropolitan GDP grew 1.3% between 2019 and 2020.
6. Daytona Beach, Florida
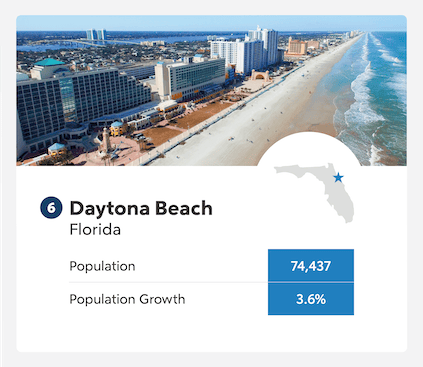
Daytona Beach has long been a coastal destination for tourists, offering beautiful beaches on Florida’s east coast and welcoming motorsports enthusiasts each February for the Daytona 500 race.
The city’s population is booming, with a 3.6% increase in 2021, as more Americans decide the beach is something they want in their daily lives. Residential building permits in the metro area, which include Deltona, Florida, also increased 38% to keep up with incoming residents.
- Daytona Beach has a population of 74,437 – a 3.6% increase from 2020.
- The city’s metropolitan GDP fell just shy of the top 25, ranking 26th with a 1.3% increase.
- Single-unit residential building permits increased 38% to 6,753 permits in 2021.
7. Edinburg, Texas
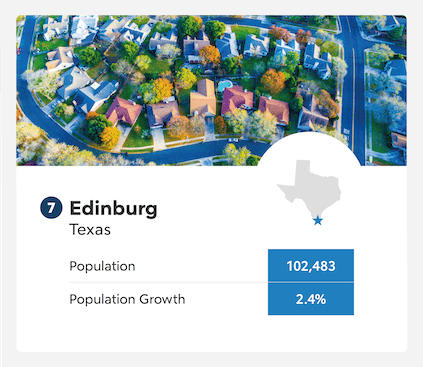
Edinburg is a southern Texas city in the heart of the Rio Grande Valley and just north of the U.S.–Mexico border. The city’s a growing hub for health care and home to the University of Texas Rio Grande Valley.
Its location near the border makes it an ideal spot for economic growth, and the city’s GDP increased 1.7% in 2020 – 18th in our study. The population passed 100,000 in 2020 and continued to grow 2.4% to 102,483 in 2021.
- Single-unit residential building permits increased 39% to 4,844 in the McAllen-Edinburg metro area.
- The metropolitan employment rates increased 5.9% in 2021.
- Edinburg’s population increased 2.4% to 102,483 in 2021.
8. Madera, California
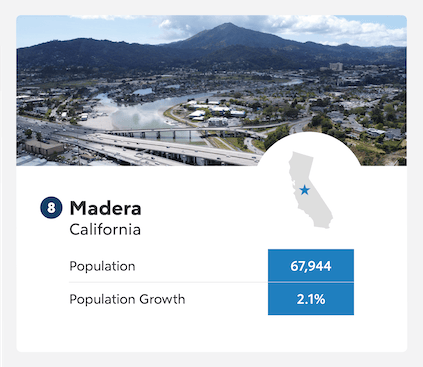
Madera is the largest city in the identically named Madera County of Central California. The county includes parts of the Sierra National Forest and Yosemite National Park in its borders west of Madera city.
The city ranked fifth for residential building permits with a 46% increase in 2021, and ranked 30th or higher for all other study metrics.
- Madera’s population increased 2.1% to 67,944 residents in 2021.
- The city’s metropolitan area GDP grew 1.3% in 2020.
- Madera ranked 30th in our study for employment rate growth at 6.2%.
9. Palm Bay, Florida
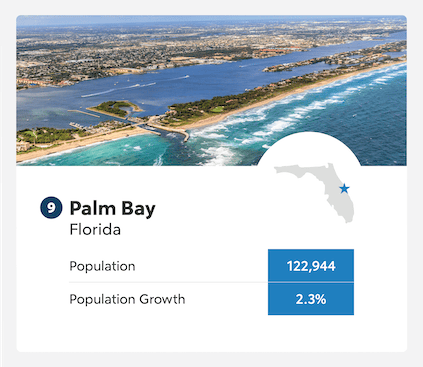
Palm Bay is the perfect place to grow for residents who enjoy hiking, boating and other outdoor activities along the central Florida coast. There’s no shortage of family fun with 29 parks, including space for paintball, skateboarding, golf and more.
Despite Palm Bay’s growing engineering and technology industries, the city’s employment rates increased just 5% in 2021. Still, the population grew to 122,944 and the city continues to invest in residential housing.
- The population grew 2.3% to 122,944 citizens in 2021.
- Residential building permits increased 34%.
- The metropolitan GDP increased 1.2% in 2020 – ranking 34th among our top cities.
10. Roseville, California
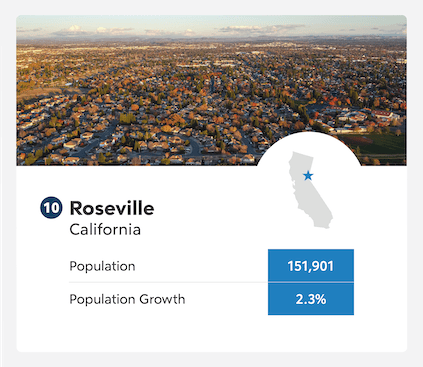
Roseville is part of the Sacramento metro area of Northern California and a dream destination for shoppers. The Westfield Galleria at Rosefield is home to several luxury retailers and is one of several major shopping centers in the city.
Roseville rounds out our top 10 fastest-growing cities, with a population increase of 2.3% and a total of 151,901 residents.
- The Sacramento metro area awarded 29% more single-unit building permits in 2021 than the previous year, for a total of 9,390.
- Roseville’s employment rates increased 7.2% in 2021.
- Roseville’s population is 151,901 citizens – a 2.3% increase from 2020.
11. Burlington, North Carolina
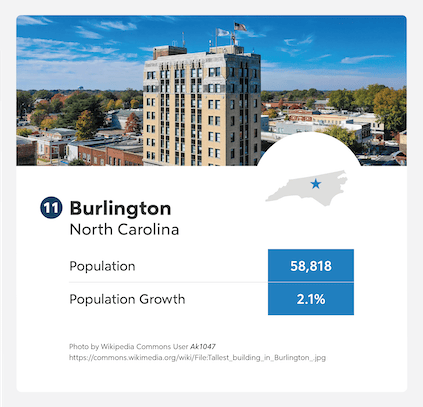
Burlington is under an hour’s drive from other major North Carolina cities Greensboro, Durham, Chapel Hill and Raleigh, and offers the beauty of North Carolina at a much more affordable rate – a strong benefit for many Americans, says Michael Kotler of eXp Realty.
“North Carolina’s another attractive option to escape the northeast winters, and get much more bang for your buck, housing-wise,” he says. “These people are generally 100% remote, and they figure, why deal with subpar weather, high taxes and congested areas when they don’t have to anymore?”
- Burlington’s population increased 2.1% to 58,818 residents in 2021.
- Residential building permits increased 32% in 2021.
- The area’s metropolitan GDP decreased 2.4% and employment rates increased 4.3%.
12. St. George, Utah
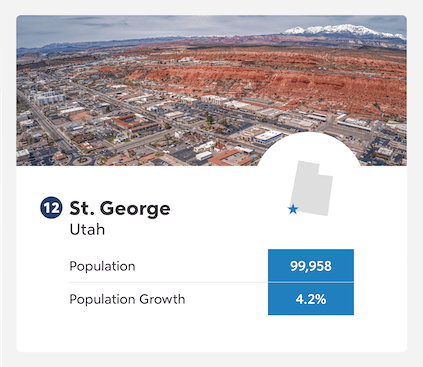
St. George is part of the Greater Zion area of southwest Utah along the Arizona border. Its location is unique in that it’s surrounded by three distinct ecoregions: the Mojave Desert, Colorado Plateau and Great Basin, and its climate is much warmer than the rest of the state.
- St. George had the 5th highest population increase at 4.2% with a population of 99,958 people.
- The city also ranked 5th for metro GDP growth at 3.5%.
- City employment rates increased 7% in 2021.
13. Auburn, Alabama
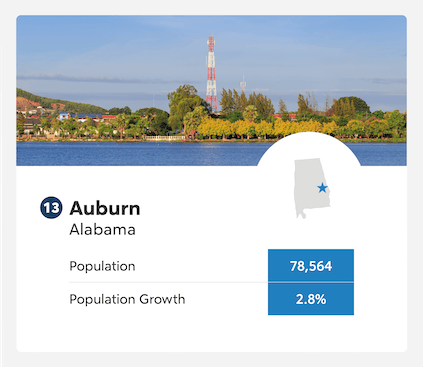
The college town of Auburn is situated in eastern Alabama and considered part of the Deep South. The city has plenty to do and see, and is home to several museums, the Donald E. Davis Arboretum, and Auburn University. Adventurous residents can also explore the Tuskegee National Forest, just west of Auburn.
- Auburn has a population of 78,564 – a 2.8% increase year over year.
- It ranked 54th in our study for new residential building permits with a 13% increase in 2021.
- The metro GDP increased 1.6% in 2020.
14. Greenville, South Carolina
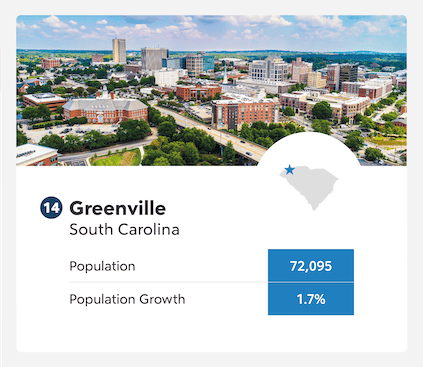
Greenville is situated near the Blue Ridge Mountains with stunning views and nature trails to enjoy the South Carolina Upcountry. The pedestrian-friendly downtown is also a hit for family entertainment with a variety of small shops, art galleries and more.
- Greenville increased its single-unit building permits by 37%.
- The population grew 1.7% to 72,095 residents in 2021.
- Employment rates increased 4.6%, while the metro GDP dropped 0.3%.
15. Murfreesboro, Tennessee
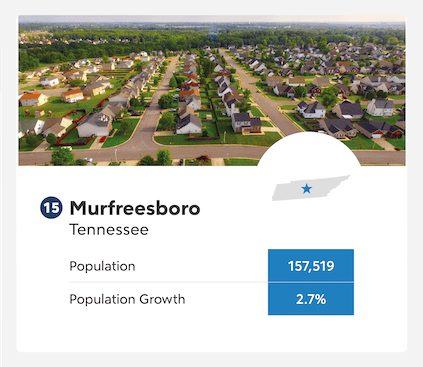
American history buffs have plenty to learn in Murfreesboro and can check out the city’s heritage center, the Oaklands Mansion and wetlands, and the Stones River National Battlefield. There are plenty of family-friendly activities, too, including the Middle Tennessee Museum of Natural History and the Discovery Center at Murfree Spring.
Tennessee has plenty to do and see, and at an affordable price. Erik Wright of New Horizon Home Buyers has seen how a great economy and low living costs attract new residents.
“Many cities in Tennessee boast about having the most considerable six-figure job growth, and this draws people to these cities,” he says. “Some other cities have a high cost of living and little possibility for that same job growth, including Honolulu and, surprisingly, New York City, which is why people are leaving.”
- Murfreesboro’s population grew 2.7% to 157,519 residents in 2021.
- The metro GDP had the largest decrease of our ranking cities at 4.1% and ranked 91st.
- Employment rates increased 7.7% and earned 10th in our study.
16. Idaho Falls, Idaho
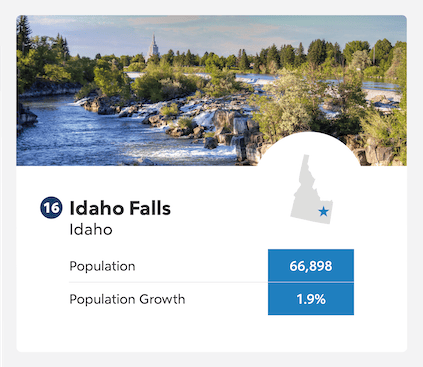
Idaho Falls has something for everyone, including the Idaho Falls Zoo, Wes Deist Aquatic Center, a civic auditorium and even the War Bonnet Round Up rodeo, which invites over 450 cowboys and cowgirls to saddle up for Idaho’s oldest rodeo.
- Idaho Falls has 66,898 residents – a 1.9% increase in 2021.
- The city ranked 28th for residential building permits with a 26% increase in single-unit permits.
- The Idaho Falls metropolitan area saw a 0.9% GDP increase in 2020.
17. Rapid City, South Dakota
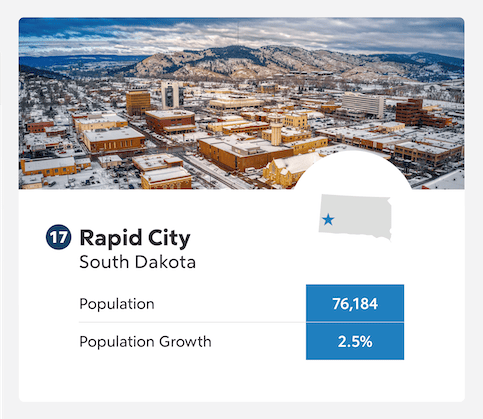
Rapid City is east of Black Hills National Forest of South Dakota, a stunning mountain range with views of Mt. Rushmore and adjacent to Badlands National Park and several other national parks and monuments. This vibrant city also offers unique shopping, dining and cultural experiences for fun in and out of the parks.
- Rapid City ranked 15th for overall population growth with a 2.5% increase to 76,184 residents.
- The metro GDP grew 2.1% in 2020, ranking 17th in our study.
- Residential building permits increased 12% to 924.
18. Round Rock, Texas
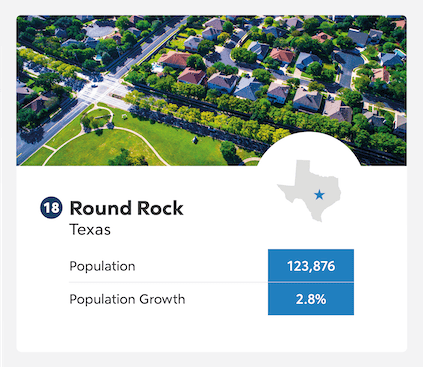
Round Rock is one of Austin’s largest suburbs, just 15 miles north of the capital city in the Texas Hill Country. The city is known as the Sports Capital of Texas and has a thriving economy and growing industry health care and technology employers. Recent surveys say that 90% of citizens are satisfied with their quality of life,2 so it’s no surprise big-city residents are willing to try the suburbs instead.
“By and large, we’re seeing people move from one major city (like NYC) to another, or to the close-in suburbs of such cities. The vast majority of moves that occur are within a given city or metro area (upwards of 90%); however, the increased adoption of remote work has allowed for more flexibility than in previous years,” shares Voyo Popovic, CEO of Piece of Cake Moving & Storage.
- Round Rock’s population increased 2.8% to 123,876 residents.
- The city ranked highest of our top cities for employment rate increases with a 9.8% increase, ranking fourth.
- The area metro GDP is in the top 10 with a 2.8% increase in 2020.
19. Conway, Arkansas
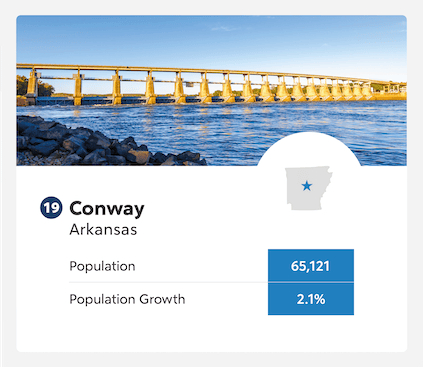
Conway has its roots deep in education with three college campuses in town, including Hendrix College, University of Central Arkansas and Central Baptist College. This may contribute to citizens’ community-mindedness, and residents average much younger than most cities with a median age of 27.3.3
- Conway’s population reached 65,121 after a 2.1% increase in 2021.
- Residential building permits increased 14% to 2,505 in the Little Rock–Conway metro area.
- The metro GDP decreased 0.2% in 2020, and employment rates grew just 4.3% in 2021.
20. Pocatello, Idaho
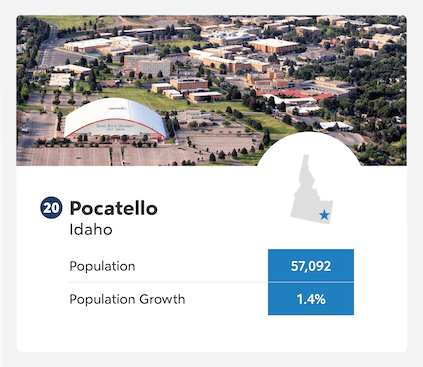
West of the Rocky Mountains and the famed Oregon Trail is Pocatello, the 20th fastest-growing city on our list. With over 32 parks,3 biking and hiking trails, and the Nordic Center for cross-country skiing, it’s an ideal destination for outdoor enthusiasts. The city was founded as the “Gateway to the Northwest,” settled by immigrants during the gold rush before transitioning to agriculture.4
- Pocatello’s population increased 1.4% to 57,092 residents.
- The city increased its residential building permits by 27%.
- Pocatello ranks 11th for metro GDP growth at 2.5%.
Top 100 Fastest-Growing Cities | ||
|---|---|---|
City | State | Population Growth (percentage) |
Fort Myers | Florida | 6.8% |
Cape Coral | Florida | 4.2% |
North Port | Florida | 5.5% |
Winter Haven | Florida | 4.2% |
New Braunfels | Texas | 8.3% |
Port St. Lucie | Florida | 5.2% |
Daytona Beach | Florida | 3.6% |
Edinburg | Texas | 2.4% |
Madera | California | 2.1% |
Palm Bay | Florida | 2.3% |
Roseville | California | 2.35% |
Burlington | North Carolina | 2.15% |
St. George | Utah | 4.2% |
Auburn | Alabama | 2.8% |
Greenville | South Carolina | 1.7% |
Murfreesboro | Tennessee | 2.7% |
Idaho Falls | Idaho | 1.9% |
Rapid City | South Dakota | 2.5% |
Deltona | Florida | 1.4% |
Round Rock | Texas | 2.8% |
Conway | Arkansas | 2.1% |
Pocatello | Idaho | 1.4% |
Merced | California | 3.2% |
Rogers | Arkansas | 1.4% |
Lubbock | Texas | 1.2% |
Sioux Falls | South Dakota | 1.7% |
College Station | Texas | 1.3% |
Logan | Utah | 3.4% |
Sarasota | Florida | 1.1% |
Bowling Green | Kentucky | 1.2% |
Beaumont | California | 3.2% |
Franklin | Tennessee | 1.9% |
McAllen | Texas | 1.1% |
Fayetteville | Arkansas | 1.3% |
Grand Junction | Colorado | 1.7% |
Bryan | Texas | 1.2% |
Bend | Oregon | 2.5% |
Richland | Washington | 1.9% |
Fort Worth | Texas | 1.4% |
Wilmington | North Carolina | 1.3% |
Mansfield | Texas | 2.2% |
Spokane Valley | Washington | 2% |
Concord | North Carolina | 1.8% |
Warner Robins | Georgia | 1.2% |
Salem | Oregon | 1.1% |
Knoxville | Tennessee | 1.1% |
Coeur d’Alene | Idaho | 2.1% |
Las Cruces | New Mexico | 1.1% |
Hanford | California | 0.8% |
Ocala | Florida | 0.8% |
Clarksville | Tennessee | 2.2% |
Reno | Nevada | 1.8% |
Killeen | Texas | 2.1% |
San Antonio | Texas | 0.9% |
Tyler | Texas | 1.1% |
Henderson | Nevada | 1% |
Melbourne | Florida | 0.8% |
North Charleston | South Carolina | 1.5% |
West Des Moines | Iowa | 1.3% |
Carmel | Indiana | 0.95% |
Bellingham | Washington | 0.85% |
Missoula | Montana | 1.2% |
Bradenton | Florida | 0.7% |
Tampa | Florida | 0.8% |
New Haven | Connecticut | 0.8% |
Johnson City | Tennessee | 1% |
Gastonia | North Carolina | 1% |
Ontario | California | 1.1% |
Yuma | Arizona | 1.1% |
Tuscaloosa | Alabama | 0.7% |
Fort Wayne | Indiana | 0.7% |
Phoenix | Arizona | 0.8% |
Greenville | North Carolina | 0.7% |
Columbia | Missouri | 0.8% |
Bakersfield | California | 1% |
Boise | Idaho | 0.7% |
Waco | Texas | 0.9% |
Oklahoma City | Oklahoma | 0.7% |
Huntsville | Alabama | 0.9% |
Fort Smith | Arkansas | 0.5% |
Jonesboro | Arkansas | 0.7% |
Colorado Springs | Colorado | 0.8% |
Kennewick | Washington | 0.7% |
Lawton | Oklahoma | 0.6% |
Las Vegas | Nevada | 0.5% |
Mesa | Arizona | 0.7% |
Riverside | California | 0.8% |
Champaign | Illinois | 0.8% |
Visalia | California | 0.8% |
Medford | Oregon | 0.6% |
Fargo | North Dakota | 0.7% |
Orlando | Florida | 0.5% |
Ames | Iowa | 0.6% |
Bismarck | North Dakota | 0.6% |
Carson City | Nevada | 0.5% |
Olympia | Washington | 0.5% |
Brownsville | Texas | 0.6% |
Janesville | Wisconsin | 0.5% |
Charleston | South Carolina | 0.5% |
Santa Fe | New Mexico | 0.6% |
Fastest-Growing States In The US
Southern cities with comfortable climates and strong economies took a majority of our ranking positions.
Florida is by far the fastest-growing state, claiming four of our top five cities with six placements in the top 20. It’s hard to beat beautiful beaches on either coast, and residents can choose between a number of bustling cities for business or nightlife, or smaller suburbs and country towns with freshwater lakes and wetlands to explore.
Texas came in second, with a booming population and three cities earning placements in our top 20 list. The warm weather across seasons and lack of income tax are especially attractive qualities for remote workers and retirees looking to escape harsh winters and congested cities.
California is our third most popular state for Americans looking for their next move. There’s no shortage of business opportunities across large and midsize cities. New Californians can choose between sunny southern cities, desert destinations and the moderate oceanic climate of Northern California.
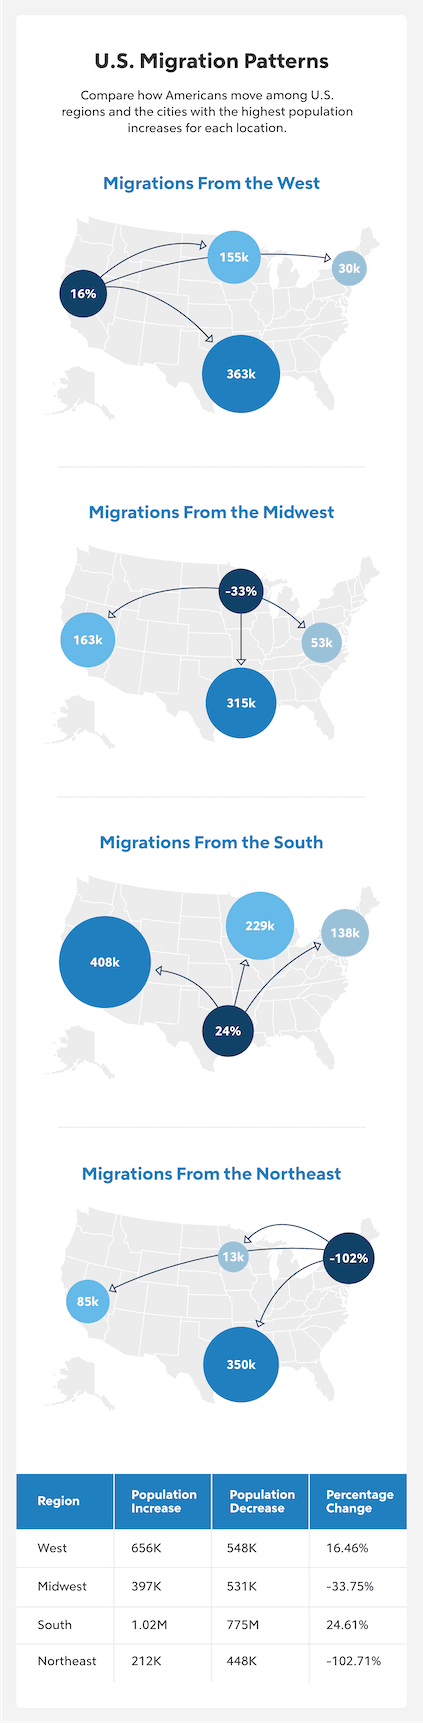
Regional Migrations
Southern states are growing rapidly with a 24.61% population increase in 2021. The West is also growing steadily at 16.46% year over year.4 The mild climates of these regions play a large role in attracting new residents, as does the economic opportunity of growing metropolitan areas.
The Midwest and Northeast each lost more residents than they gained in 2021. Midwest states lost over 531,000 residents, resulting in a 33.75% decrease. The Northeast’s loss was even more extreme, with over 448,000 residents moving outside the region for a 102.71% decrease.
The Bottom Line
Remote work has opened opportunities for more individuals and families to move without worrying about a new job, so they can live in a city that suits them.
Climate, recreation, community and cost of living are all major considerations that are driving Americans to move away from densely populated cities to suburbs and warm weather metros.
Planning your next big move? Compare your mortgage options and decide what’s right for you and your dream home.
Methodology
This city study was completed using data sourced in September 2022. We began by selecting the 200 fastest-growing cities based on census population data alone, then considered these additional population and economic metrics. Weights for each metric are available below:
Sources:


Victoria Araj
Victoria Araj is a Staff Writer for Rocket Companies who has held roles in mortgage banking, public relations and more in her 15-plus years of experience. She has a bachelor’s degree in journalism with an emphasis in political science from Michigan State University, and a master’s degree in public administration from the University of Michigan.